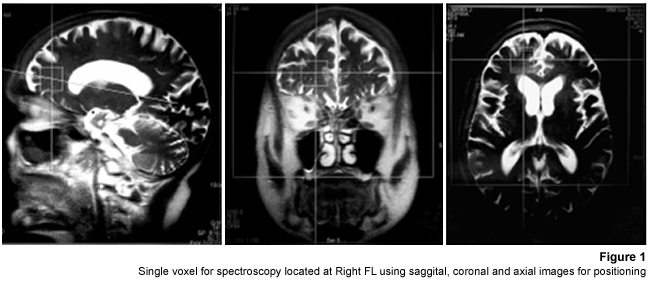
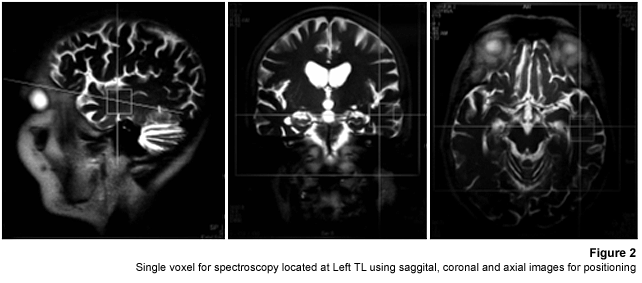
Twelve moderate AD patients were studied after obtaining both their informed consent and their caregivers? and the approval of the local ethical committee. The patients took Rivastigmine during 16 weeks (1.5 mg/day the first two weeks, 3 mg/day the following six weeks, and 4.5 mg/day the last eight weeks). Mini Mental State Examination (MMSE) (55) was performed twice: the first one was carried out at the beginning of the study (0 week) and the second one, 16 weeks after receiving Rivastigmine.
Magnetic Resonance Imaging (MRI) and MRS
MRI was performed using a 1.5 Tesla system with spectroscopy capability (Magnetom Sonata, Siemens Medical Systems®, Erlangen, Germany) equipped with a standard Head Coil. Sagittal T1 weighted, Coronal T2 weighted, Axial T2 weighted and T2 Fluid Attenuated Inversion Recovery (FLAIR) images were performed. Single Voxel Spectroscopy was acquired with a 90°-180°-180° Spin-Echo Sequence obtained from a 1.8 cm x 1.8 cm x 1.8 cm = 5.83 cm3 voxel located at Frontal Lobe (FL) and Temporal Lobe (TL). Voxels were prescribed from a saggital, coronal, and axial image series. The parameters used were: Echo Time (TE) = 135 ms, Repetition Time (TR) = 1500 ms, 256 acquisitions. NAA, Cr, Cho, and mI intensity signals were detected and NAA/Cr, mI/Cr, Cho/Cr and NAA/mI ratios were calculated. Typical voxel locations at FL and TL are shown in Figures 1 and 2.


MRI clinical applications allowed us to perform spectroscopic examinations on a data acquisition time limited to 30 min per subject according to the tolerance of the patients. FL study obeys to AD patients previous history of deficits in frontal system tasks with variable changes in memory (56). Volume of Interest (VOI) selection at TL was done based on previous reports of abnormalities in patients with AD (57-58). Analysis of Variance (ANOVA) was applied to the results. Tukey test was used for multiple comparisons among ratio means with Bonferroni correction for small samples. Multiple linear regression analysis was performed to assess differences in brain metabolite ratios between the two observations. Spearman rank correlation coefficients were calculated for both MMSE scores and measured metabolite ratios.