Bioquímica cerebral
1H Magnetic Resonance Spectroscopy Assessment of the Effects of Rivastigmine on Patients with moderate Alzheimer Disease
Results
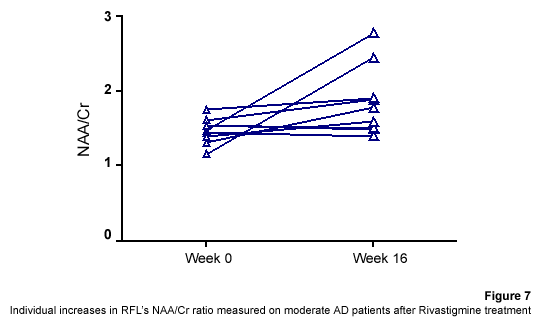
Table 1 represents the four metabolite ratios calculated according to the anatomic region studied (Temporal Lobe or Frontal Lobe) and the Rivastigmine administration by the time the examination was performed (Week 0 or Week 16). NAA/Cr ratio at the RFL and NAA/mI levels at the LTL show significant differences after 16 weeks of Rivastigmine administration when Tukey test was applied for comparisons among ratio means with Bonferroni correction for small samples (p<0.05).
|
REGION OF INTEREST |
NAA/Cr |
mI/Cr |
Cho/Cr |
NAA/mI |
| RTL WEEK 0 |
1,89 ± 0,55 |
1,01 ± 0,23 |
0,74 ± 0,24 |
1,93 ± 0,62 |
| RTL WEEK 16 |
1,40 ± 0,39 |
0,89 ± 0,47 |
0,92 ± 0,29 |
2,30 ± 1,79 |
| |
|
|
|
|
| LTL WEEK 0 |
2,03 ± 0,36 |
1,00 ± 0,36 |
0,77 ± 0,08 |
1,67 ± 0,51 ? |
| LTL WEEK 16 |
1,88 ± 0,25 |
1,07 ± 0,42 |
0,74 ± 0,14 |
2,70 ± 1,21 ? |
| |
|
|
|
|
| RFL WEEK 0 |
1,46 ± 0,21 ? |
1,00 ± 0,33 |
0,79 ± 0,19 |
1,74 ± 0,73 |
| RFL WEEK 16 |
1,96 ± 0,46 ? |
1,08 ± 0,29 |
0,84 ± 0,14 |
1,74 ± 0,38 |
| |
|
|
|
|
| LFL WEEK 0 |
1,97 ± 0,30 |
1,05 ± 0,31 |
0,94 ± 0,19 |
2,06 ± 0,78 |
| LFL WEEK 16 |
1,90 ± 0,71 |
1,01 ± 0,18 |
0,84 ± 0,31 |
1,86 ± 0,40 |
Table 1
Summary of changes in metabolite ratios as an effect of Rivastigmine administration
RFL: Right Frontal Lobe. LFL: Left Frontal Lobe. RTL: Right Temporal Lobe. LTL: Left Temporal Lobe
? p< 0.05 |
|
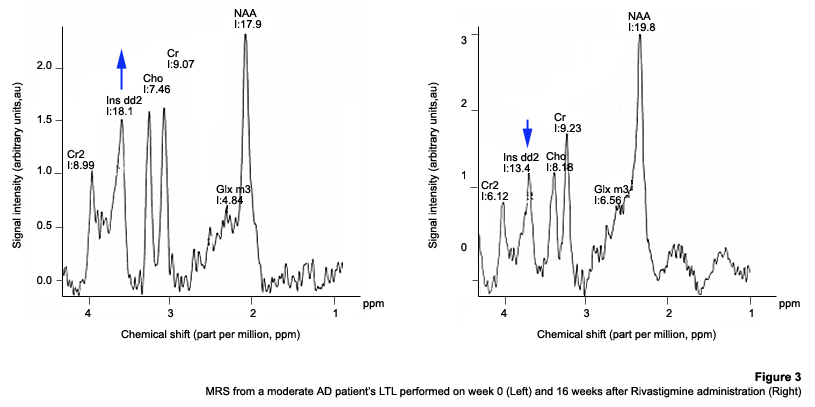
Figure 3 shows MRS performed at the LTL in a moderate AD patient on week 0 (Left) and 16 weeks after Rivastigmine treatment (Right). It is clearly noticeable the significant change (p<0.05) in NAA/mI levels between the two observations. NAA/mI ratio increased from 0.99 (week 0) to 1.48 (week 16). |
|
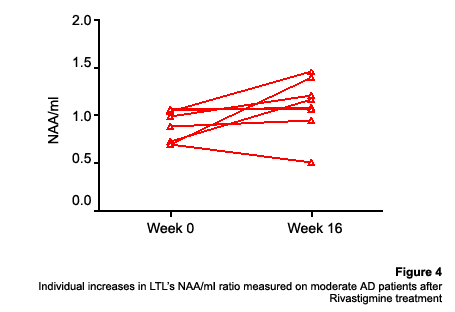
Figure 4 represents individual values of NAA/mI ratio measured at the LTL in moderate AD patients who participate in our study. |
|
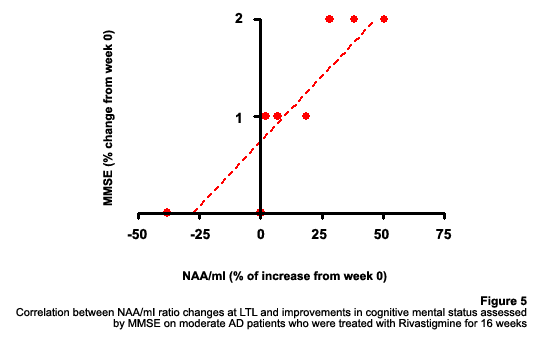
Figure 5 shows the correlation between MMSE changes and the increase of the NAA/mI ratio at the LTL in moderate AD patients treated with Rivastigmine for 16 weeks. r Spearman coefficient was = 0.94, p<0.004. |
|
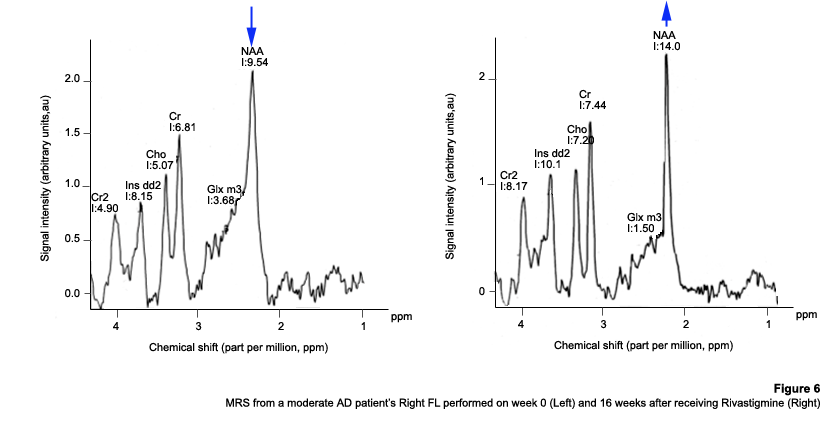
Figure 6 represents MRS performed at the RFL in a moderate AD patient on week 0 (Left) and 16 weeks after Rivastigmine treatment (Right). It is clearly noticeable the significant increase (p<0.05) in NAA/Cr levels between the two observations. NAA/Cr ratio changed from 1.35 (week 0) to 2.11 (week 16). |
|
Figure 7 represents individual values for NAA/Cr ratio measured at the RFL in moderate AD patients who participate in the study. |
|
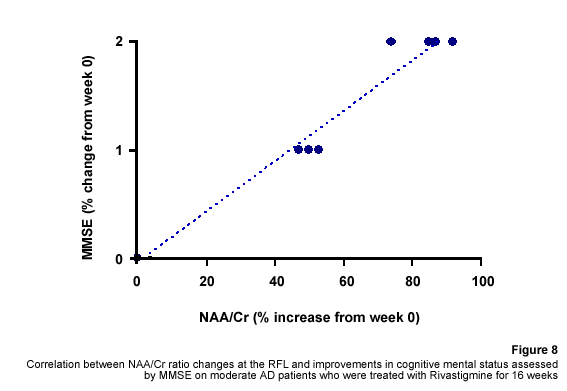
Figure 8 shows the correlation between MMSE changes and the increase of the NAA/Cr ratio at the RFL in moderate AD patients treated with Rivastigmine for 16 weeks. r Spearman coefficient was 0.97, p<0.002. |
|